Summary
Canadians are facing an affordability crisis. Basic costs such as shelter and food have risen sharply, challenging their ability to make ends meet. While the pandemic did worsen immediate cost of living concerns for many Canadians, this issue has been 40 years in the making. We analyzed how market and after-tax incomes have been distributed and compared it to the cost of living over four decades to get a clearer picture of the evolution of affordability in Canada. Since 1982,
- The cost of living has increased faster than average market income for half of Canadians
- The average market income of the top 0.01% has grown six times faster than average market income of the bottom 50% of earners
- The real after-tax average income of the poorest half of Canadians has increased at less than half the rate of real GDP per capita growth
- If real after-tax incomes for the bottom 50% had kept up with economic growth, 15 million Canadians would have had, on average, $6,450 more in their pocket in 2022
- The share of shelter costs in a typical household budget has increased from 23.4% to 31.4% in 2021
Canada’s economic growth over the past 40 years has been largely captured by the top 1%. This is the direct result of four decades of neoliberalism - a policy approach that privileges using private competitive markets to deliver all the goods and services a society needs. From a tax perspective, this has manifested itself in cuts to corporate and top personal marginal income tax rates to supposedly drive investment and productivity growth by out-competing other regions. But the neoliberal approach has not resulted in greater productivity growth. Instead it has raised incomes at the top of the scale at the expense of those in the middle and bottom. To truly make life more affordable for all Canadians, we will need to move away from neoliberal policy ideas. This includes tackling current crises with substantial public investment paid for by taxing extreme personal and corporate wealth.
Report
Affordability and neoliberalism
The affordability crisis that millions of Canadians are currently experiencing must be understood within the context of over 40 years of neoliberal economic policies. Although the pandemic and associated corporate profiteering greatly accelerated ongoing affordability concerns for many Canadians, this is an issue that has long been brewing. Economists, pundits and policymakers have struggled to explain the bad “vibes” Canadians felt about the economy amidst positive, or at least neutral, economic indicators in 2024. The economic volatility from the pandemic has settled, and so too have the ups and downs of major economic indicators, such as gross domestic product (GDP) growth and the inflation rate. But the mismatch between these indicators and Canadians’ experience of affordability points to the inability of these indicators to properly assess changes in living standards. It demonstrates the need to use a wider lens to understand how people are doing rather than dwelling on the annual and quarterly growth rates that many economists focus on.
This report contextualizes the current affordability concerns in the past 40 years of neoliberal policy decisions, presenting alternative economic indicators that better describe how low- and middle-income Canadians have fared. These indicators show that while the living standards of the wealthiest have skyrocketed over the past 40 years, the living standards of half of Canadians have barely changed at all.
What is neoliberalism?
Broadly, neoliberalism is the dominant economic ideology of our times.1 Coined in 1938, the ideas of neoliberalism only became widespread in the past 50 years. Essentially, neoliberalism is the idea that competitive markets are the only way to organize human production.2 It suggests that selfish actions will lead to the best outcomes for humankind while government and other forms of collective action are merely impediments to the operation of markets. Cloaking itself in the language of freedom and liberalism, it has expanded systems that undermine equality and the ability of people from diverse socioeconomic backgrounds to freely pursue their dreams. This ideology became significantly more influential in the 1970s and 1980s, during the tenures of Margaret Thatcher in the UK and Ronald Reagan in the US.
During the previous post-war era, it was widely accepted that there was a role for government in providing essential services, redistributing wealth, and regulating private industry. But over the past 40 years, these ideas have been eroded, leading many to believe - often on faith - that any government involvement in markets is bad.
In Canada, this shift in ideology has coincided with a range of policy changes. During the Mulroney government in the 1980s, Canada began privatizing many of its largest crown corporations, a process that was continued under the Chretien and Martin governments. In the 1990s, the federal government stopped funding co-operative and non-profit affordable housing and signed numerous “free trade” agreements. From 1970 to 2000, the top marginal tax rate on personal income fell from 80% to under 50%.3 The corporate income tax rate was cut from 41% to 29%. Organized labour was undermined, resulting in declining unionization. More recently, the private sector has become increasingly involved in the provision of healthcare. These are just some examples of major policy changes that were driven by the idea that government should do less and competitive markets should do more.
The rise of neoliberalism in Canada has been relatively successful, not in achieving its stated goals, but in increasing the power of those who pushed the idea: those who control capital. Now, the wealthiest 1% of Canadians control about one quarter of wealth in the country, and with it, they have hugely disproportionate power over the economy and public policy. This erodes our ability to democratically decide how to organize the society we live in.
Irrespective of the democratic deficits it’s engendered, neoliberalism is still sold to the public as the best way to promote investment and economic growth that leads to higher living standards for everyone. But has that really happened?
Has life become more affordable for Canadians during the neoliberal era?
Headline figures about the economy often focus on macroeconomic figures such as gross domestic product (GDP), the inflation rate, and the unemployment rate. Policymakers often portray GDP growth, in particular, as the goal of government policy. The implication is that GDP growth is good for everyone. However, while GDP does measure economic output, it cannot be used to measure prosperity, affordability or social progress.
GDP fails to account for environmental or social damages. For example, economic activity derived from war or fossil fuels extraction counts the same as that from care work or clean energy, yet with vastly different social and economic consequences. In the context of the climate crisis, this makes clear that GDP is not a meaningful indicator. Leaving this issue aside, GDP also cannot tell us who has benefitted and who has lost from changes in production. GDP would increase by the same amount if the wealthiest 10,000 Canadians collected an extra $10 million in profits as if the poorest 10 million Canadians earned an extra $10,000 in wages. This makes it a completely ineffective indicator of overall living standards or affordability, especially for the most vulnerable.
While no single number can explain how our economy is changing and who is benefiting from it, one of the best single indicators to assess affordability is the average real after-tax income4 of the bottom half of tax filers.5 This measures the real purchasing power (inflation-adjusted income after accounting for taxes and transfers) of those who are most vulnerable. One drawback of this measure is that it does not account for the value of public services that Canadians have access to - obviously, one’s real purchasing power with $30,000 is different if one has to pay $5,000 out of pocket for health care versus if health care is freely accessible. However, during periods where there have not been significant changes to the types of services that are freely publicly available, such as the past 40 years, this problem is relatively minor.
In 2022, the average real after-tax income for the bottom 50% was $20,200. What is more important is how little it has grown over 40 years in comparison to GDP.
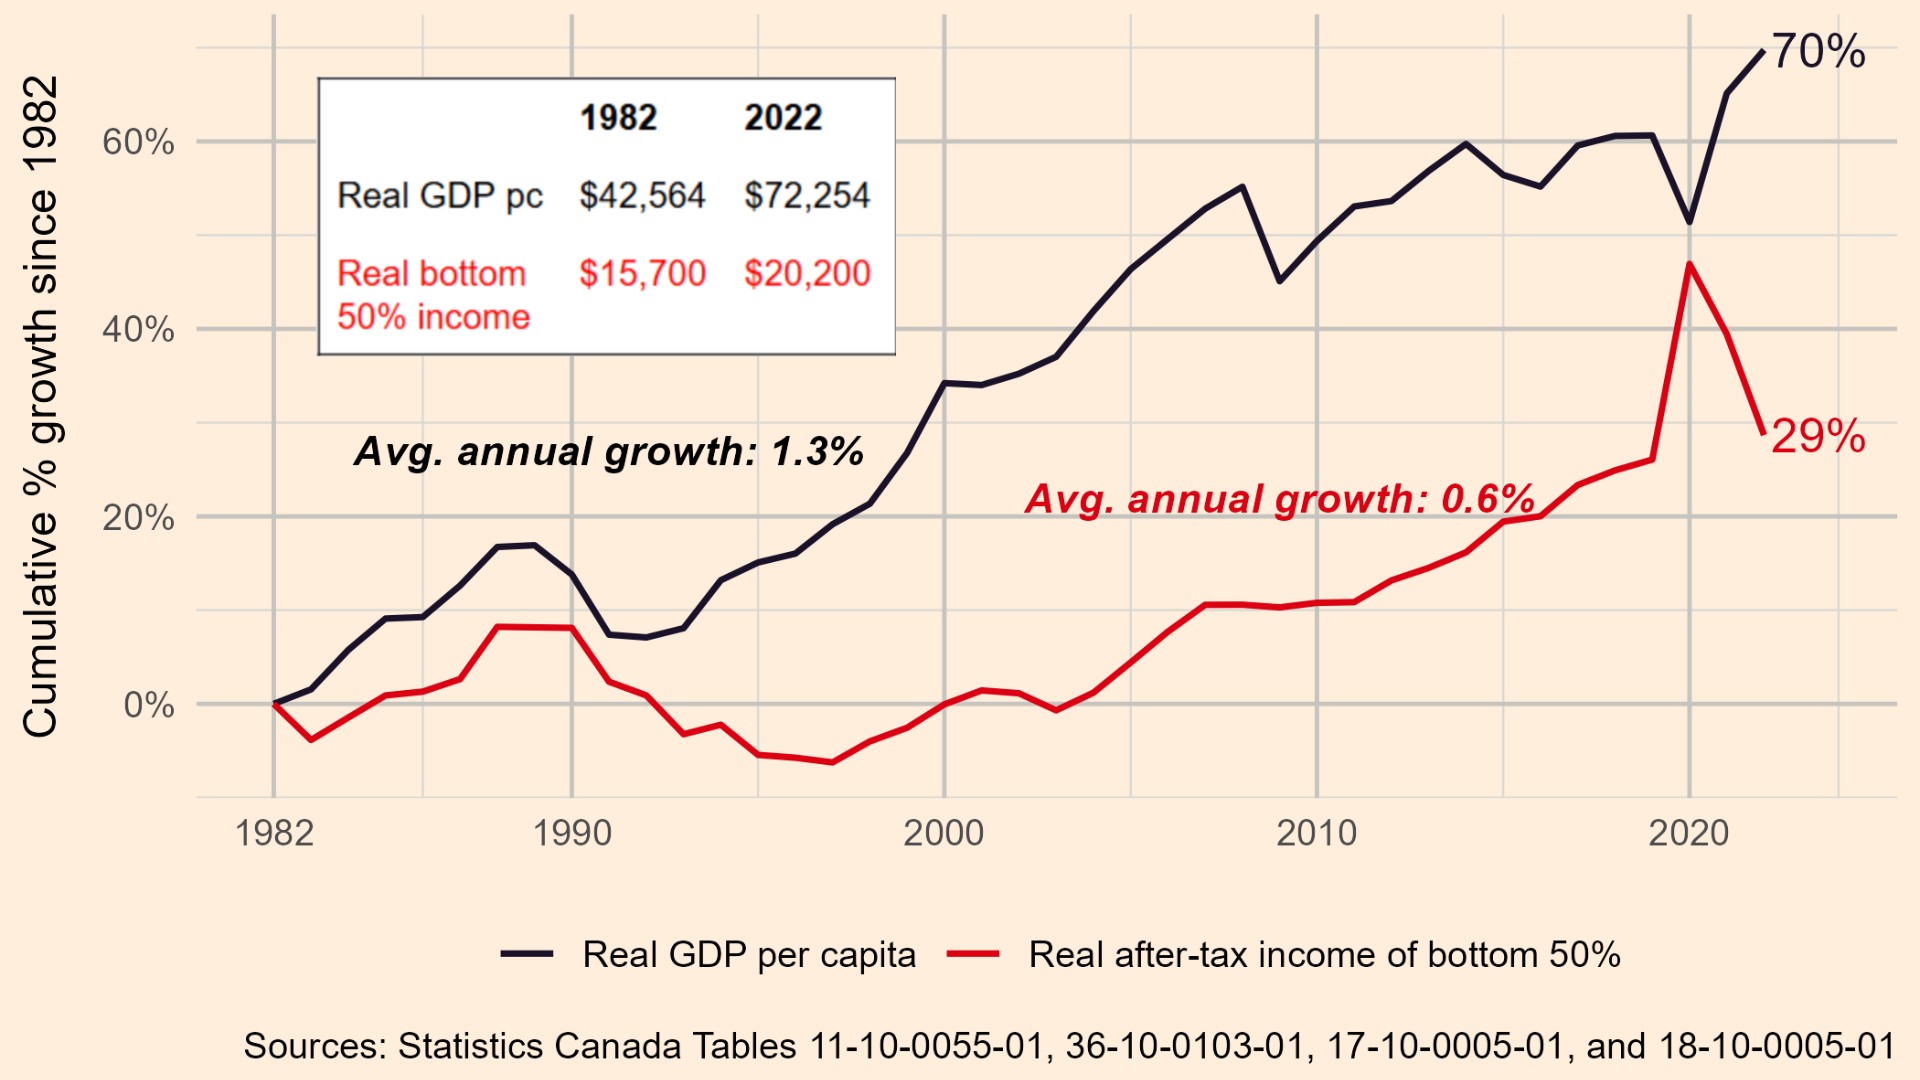
Figure 1. Real Bot 50 AT versus real GDPpc 2 - 1982-2022
Figure 1. Growth in real GDP per capita and average after-tax income for the bottom 50% of tax filers, 1982-2022.
Note. Dollar figures are in constant 2022 dollars.
Figure 1 displays the long view of how the real purchasing power of half of Canadians has evolved during the neoliberal era. Overall, since 1982 (the first year with available data), real incomes of the bottom 50% have increased by only 28.7%, an average annual growth of 0.6% per year. In contrast, real GDP per capita has increased by, on average, 1.3% per year. In dollar terms, real GDP per capita has increased by nearly $30,000 since 1982, while real after-tax income of the bottom 50% has increased by only $4,500. If real incomes for the bottom 50% had kept up with economic growth, 15 million Canadians would have had, on average, $6,450 more in their pocket in 2022.
Economic growth by no means implies that living standards will rise for everyone. During much of the 1990s, GDP per capita rose steeply while real incomes of the bottom 50% flatlined, demonstrating the complete failure of neoliberal economic policies to improve overall living standards. Since 2000, the story has been slightly different, with growth in real incomes of the bottom 50% almost keeping up with GDP growth. However, this may have more to do with the commodity price boom than a structural change in neoliberalism.6 Regardless, the extreme inequality that arose in the 1990s has persisted, not reversed.
The largest increase in real after-tax incomes for half of Canadians in the past 40 years was in 2020. This was due to pandemic-related government programs, demonstrating the power of government action to improve the lives of the most vulnerable. The removal of those programs post-pandemic led to a steep divergence between GDP and real after-tax incomes.
Why has there been such a large gap between growth in real after-tax incomes for half the population and GDP growth during the neoliberal era?
Income growth has been concentrated in the top 1%
In 2022, the price for a typical basket of goods and services purchased by a Canadian over the course of a year (measured by the Consumer Price Index; CPI) was 175% higher than it was in 1982 (average annual inflation of 2.5%). As shown in Figure 2, from 1982 to 2022, the average market income7 earned by the bottom half of tax filers increased by only 150%, less than the increase in the CPI. Market incomes for half of tax filers have grown more slowly than the cost of living over the past 40 years.
This goes a long way to explaining why real after-tax income growth for half of Canadians has been so slow. But to explain why GDP growth was more than twice as fast, we have to look at income growth at the top. From 1982 to 2022, the average market income of the top 1% of tax filers increased by 513%, nearly three times as much as inflation. If we focus even narrower on the top 0.01% (about 3,000 taxfilers in 2022), market incomes have increased by 951% since 1982.
This is the legacy of neoliberalism in Canada. Free trade, a decline in manufacturing jobs, the erosion of union density, the privatization of public services, increases in market concentration and lower corporate tax rates – these are all products of neoliberal policy changes. Through these changes, power has shifted away from workers and towards large corporations, wealthy executives and shareholders, allowing them to capture all the benefits of economic growth. If incomes had been left to the market alone, affordability would have actually declined for half the population during the neoliberal period.
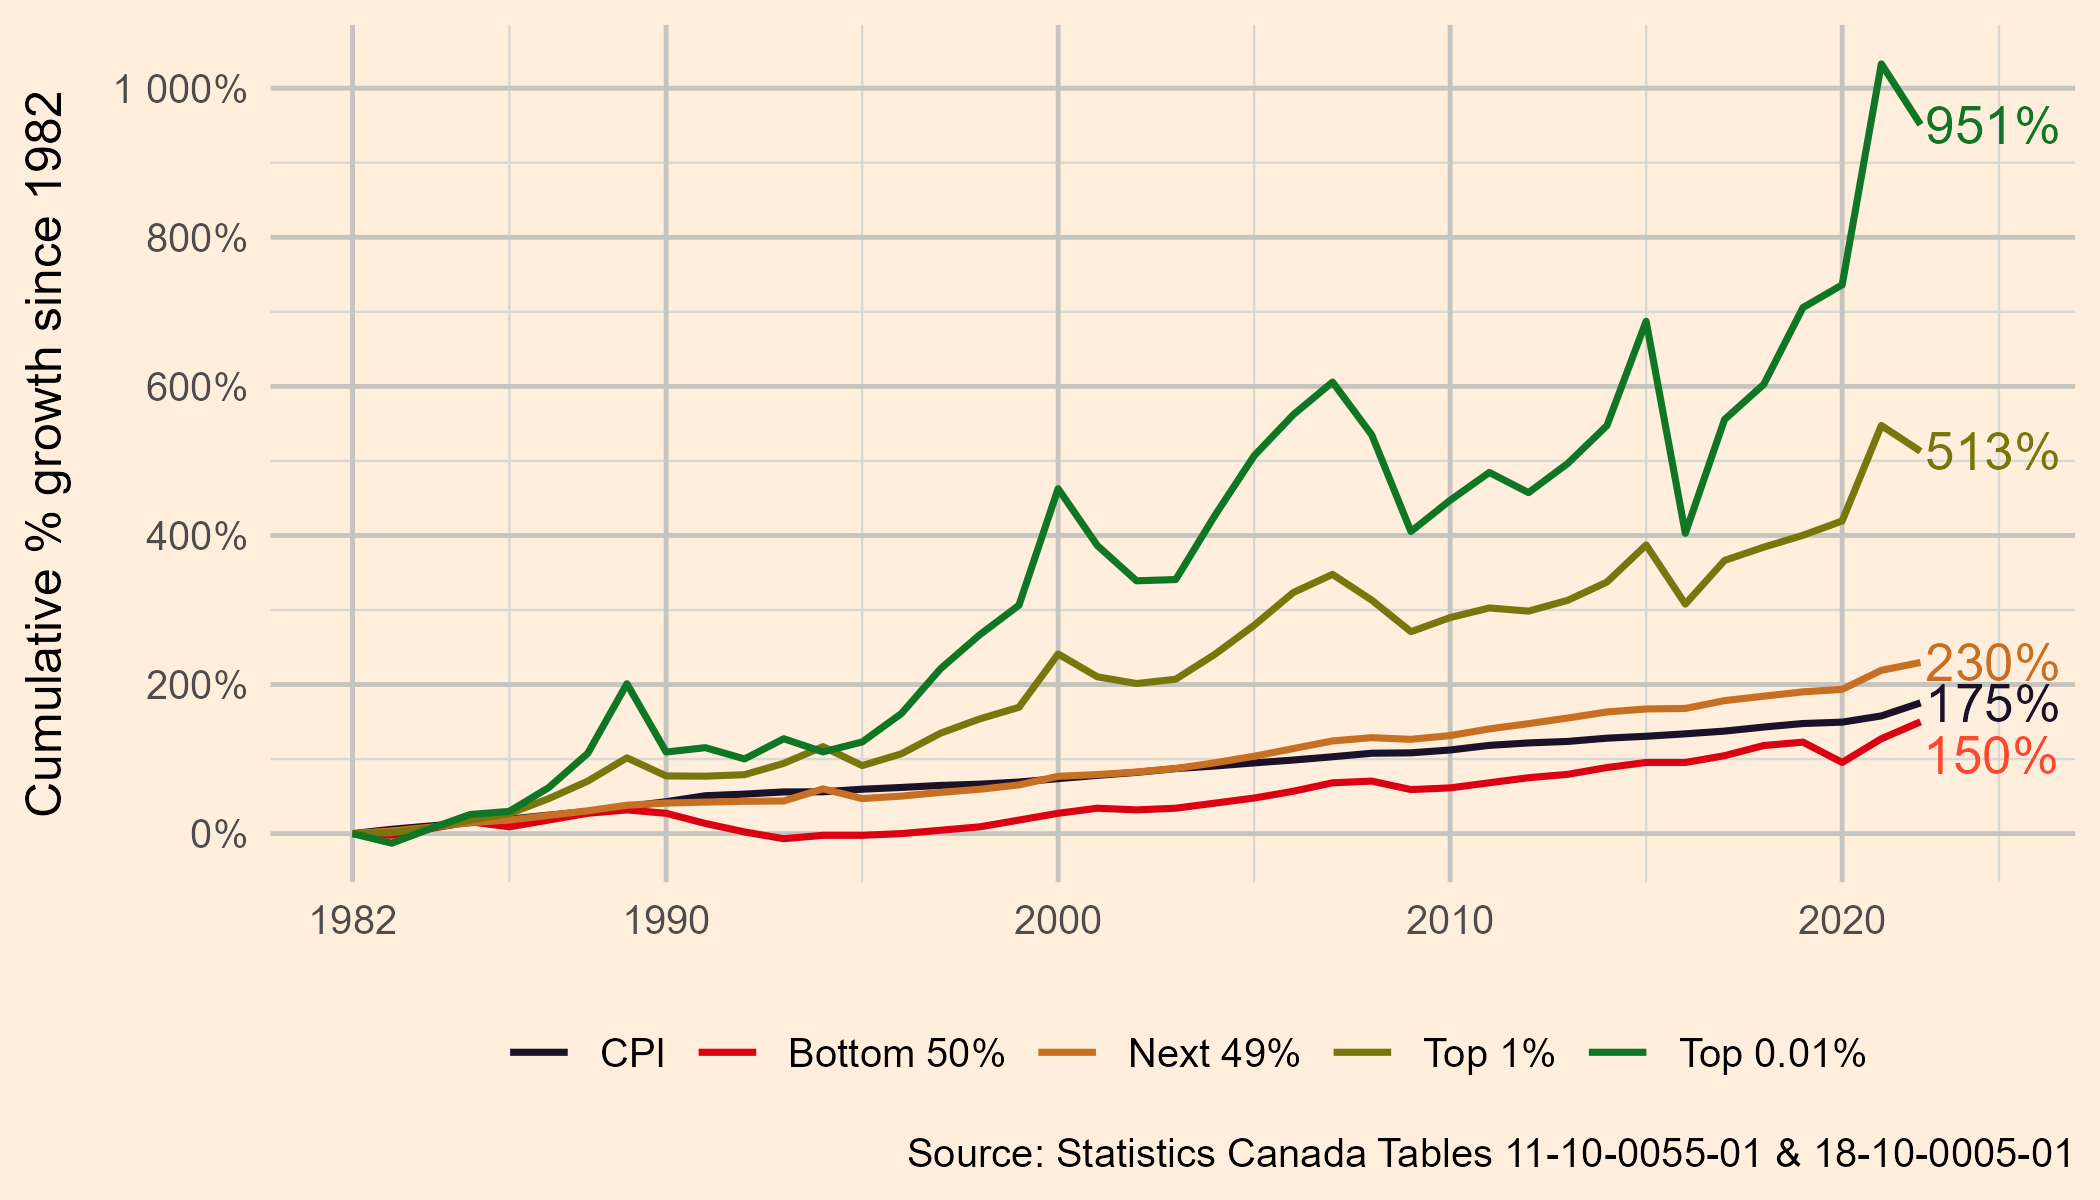
Figure 2. MK income with cap gains by group versus CPI, 1982-2022
Figure 2. Growth in market income by income group compared to growth in CPI, 1982-2022.
Our public tax and transfer system has provided some relief, particularly in the last 20 years, due to the introduction of transfers like the Canada Child Benefit. When we look at after-tax incomes in Figure 3, the amount of money in the pockets of the bottom 50% has increased by 254% since 1982, slightly more than the increase in the cost of living. But what about the incomes of the other half of the population? Well, excluding the top 1%, the top half of earners have not done any better, their incomes have increased by 242%. However, the top 1% have increased their after-tax incomes by 511% and the top 0.01% by 942%.
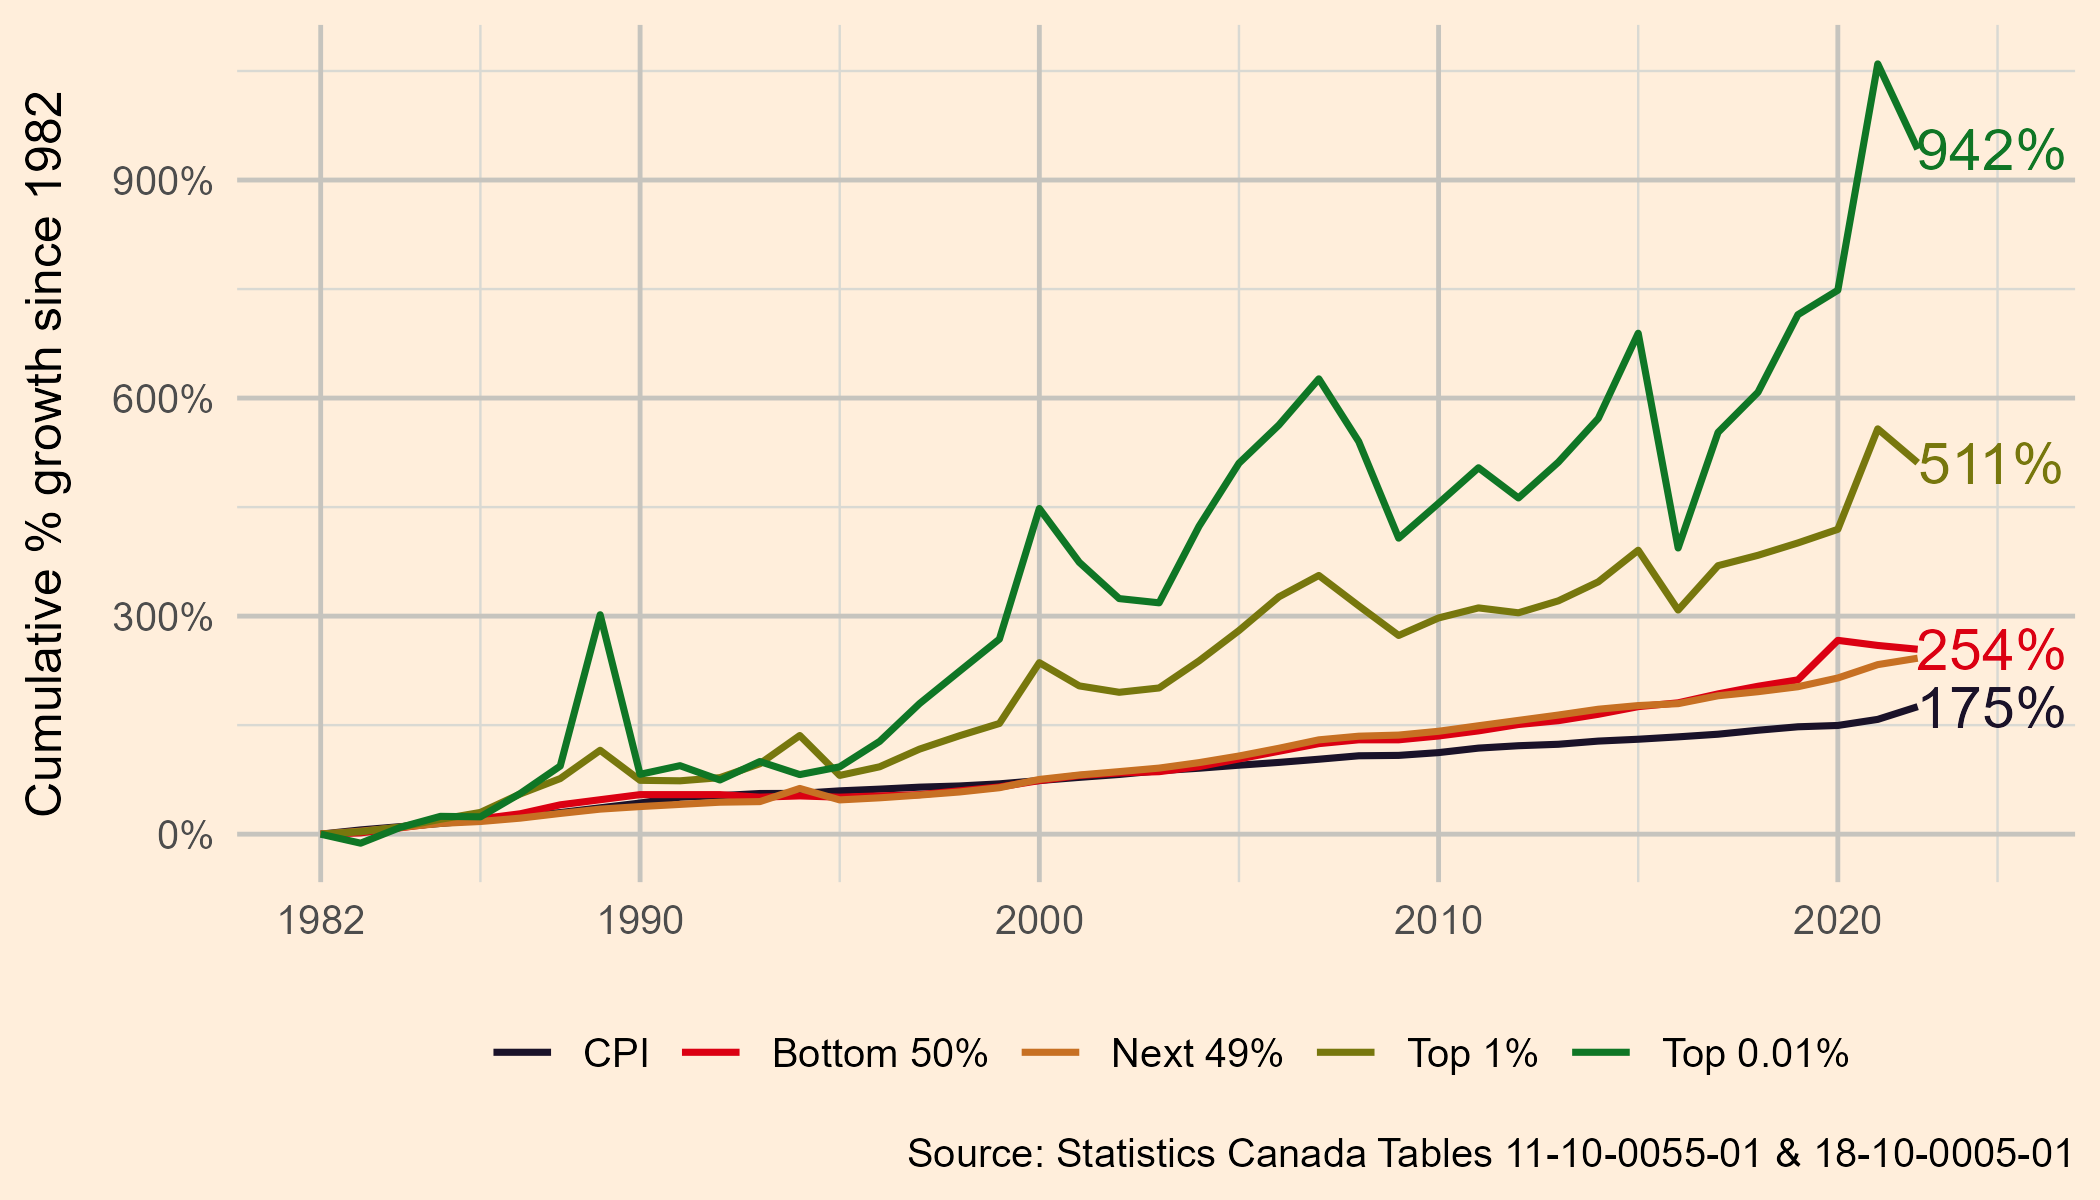
Figure 3. AT income with cap gains by group versus CPI, 1982-2022
Figure 3. Growth in after-tax income by income group compared to growth in CPI, 1982-2022.
So while the average after-tax income of the bottom 99% has increased slightly faster than prices over the past 40 years, average incomes for the top 1% have skyrocketed. This explains the significant gap between economic growth and increases in real after-tax incomes for the majority of the population, shown in Figure 1. The missing growth has been captured by the top 1%.
Affordability and essential goods
So far, we have looked at changes in incomes across the distribution and changes in the overall price level using the CPI. However, there are also some problems with using the CPI as a measure of changes in the cost of living. First, prices in the CPI are “quality-adjusted” - this means that if the quality of a good increases at the same time as its price increases, the price increase is reduced in the CPI. A good example of this is computers, which go through rapid technological innovations that raise the overall price. Because the innovations also increase computers’ “quality”, they are not reflected in an increase in the CPI.8 However, a family buying a home computer has to pay the full cost increase.
Second, the CPI weights all goods according to the share of the budget they take up for a “typical” household. This can understate affordability difficulties for low-income families in two ways. Low-income households have different consumption patterns than the average household - they spend a greater portion of their budget on shelter and groceries.9 If prices go up faster in categories that they spend more on, the CPI will understate the inflation they experience. Another issue is that all goods in a typical household budget are treated the same - price changes in groceries are treated as equivalent to changes in the price of playing sports. In reality, people are rightly more sensitive to changes in the prices of goods that they can’t live without.
During the recent inflationary period, prices of essentials like shelter and food increased faster than the overall price level, but, like the overall stagnation in living standards, this is not a new phenomenon. The prices of food and shelter have been rising faster than the overall price level for over 20 years. This means that even as real after-tax incomes for the bottom half of earners in Canada have increased over the past two decades, food and shelter have taken up an increasing share of household budgets.
In 2021, the last year with available data from the Survey of Household Spending, food reached 11.1% of household consumption spending, the highest level since 2001. Shelter took up only 23.4% of a typical household’s budget in 1982. By 2019, that had increased to 29.3%. In 2021, prior to the spike in rents observed in 2022 and 2023, shelter costs were 31.4% of a typical household’s budget.10 For households in the bottom quintile of the income distribution, shelter is an even larger burden - about 35% of average household consumption in 2021.11 The CPI cannot account for the disproportionate impact of certain prices on low-income households nor the fact that people are more sensitive to the prices of essentials.
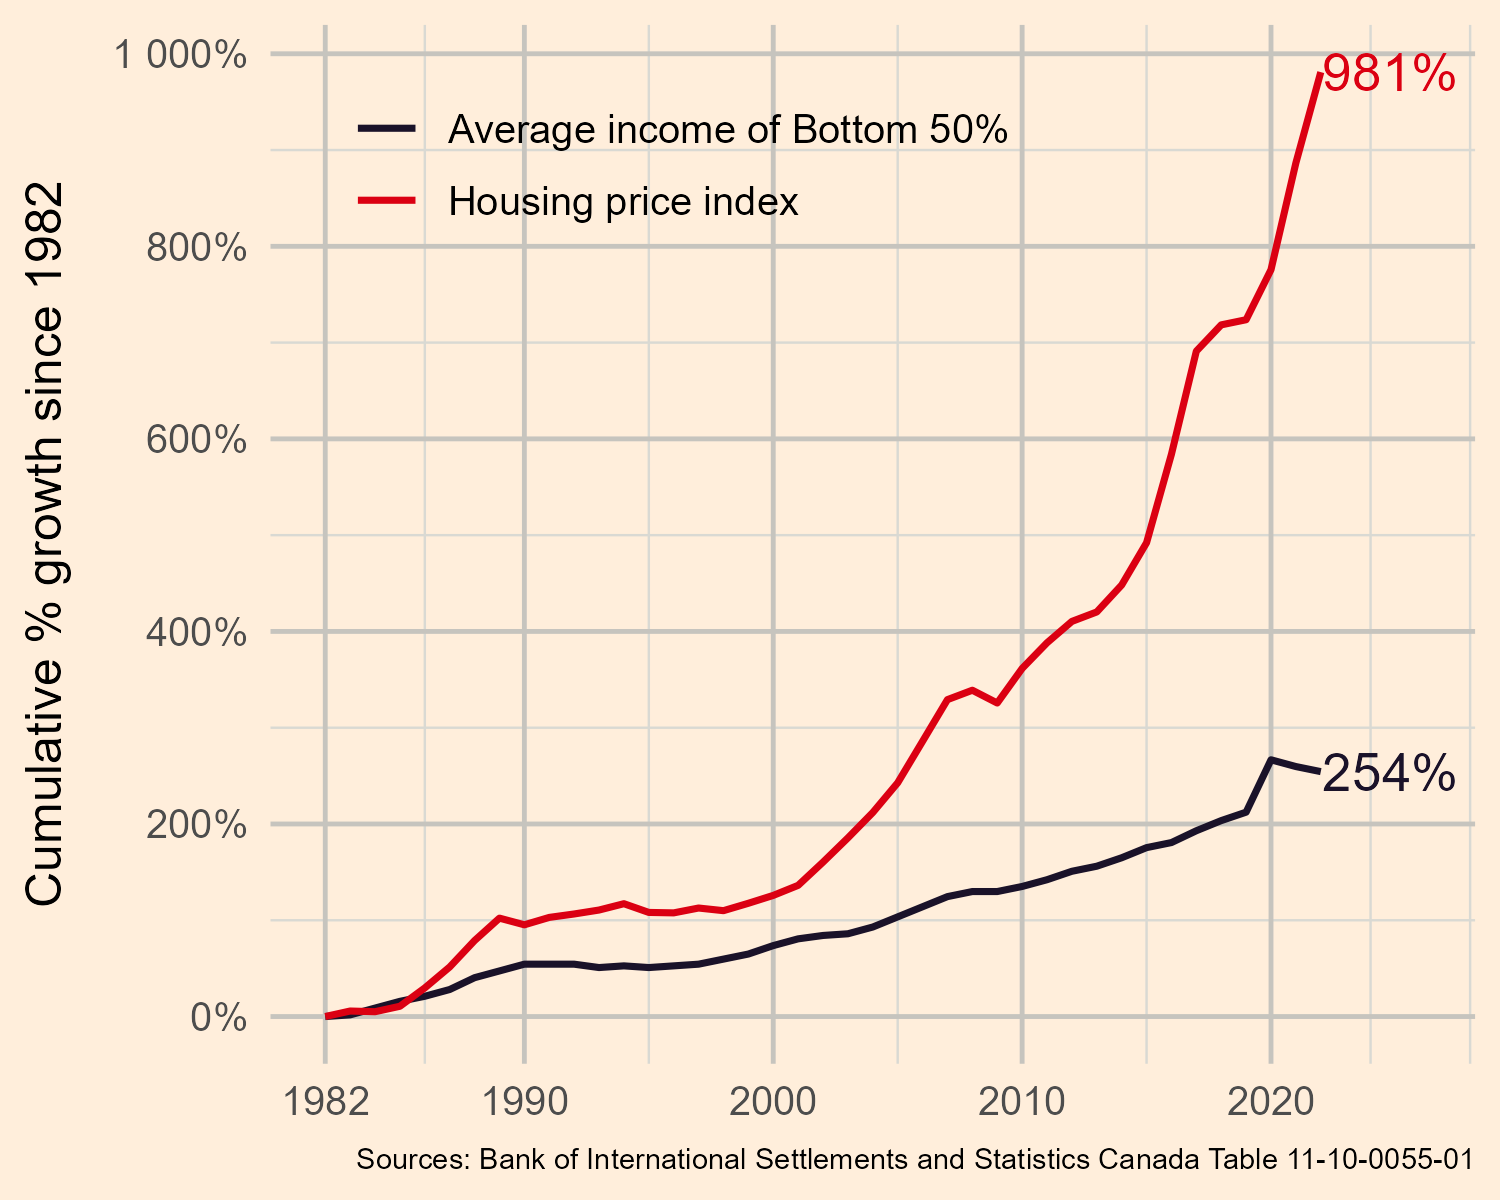
Figure 4. Bottom half average income vs housing index, 1982-2022
Figure 4. Bottom half average income vs housing index, 1982-2022
Even these figures underestimate how much housing prices have increased over time. As shown in Figure 4, residential property prices in Canada increased nearly 10-fold from 1982 to 2022. This is nearly four times larger than the increase in average after-tax income for the bottom half of the population. Only the top 0.01% of Canadians have experienced income increases as large or greater than the increase in property prices during the same period. The fall in interest rates since the 1980s has somewhat offset the impact of the increase in housing prices on household budgets and the CPI.
While it may seem like this increase in housing prices is not a problem if it has not led to higher monthly costs, it has resulted in much higher indebtedness for many Canadians. The average household debt-to-income ratio doubled from 90% in 1990 (the first year with available data) to over 180% in 2022.12 Household debt in Canada is now the highest in the G7, with households in the bottom 50% of income earners facing the greatest burden.13 This has a significant impact on financial security even when it does not increase monthly costs.
Given the growing unaffordability of home ownership, younger Canadians are increasingly turning to renting. Compared to increases in property prices, rents have risen more modestly during much of the neoliberal era. Since 2019, however, rents have increased by over one third.14 This is not only the result of a short-term lack of supply. While limited supply has played a role, rents would not have been able to increase so quickly were it not for 40 years of neoliberal policies that have redistributed income upward and decimated non-market housing.
So while the pandemic and associated inflation put further pressure on household budgets by increasing the cost of shelter, this only exacerbated a long-term trend of shelter costs growing faster than incomes for the vast majority of the population. The CPI, while a useful measure, cannot fully account for the impact of rising prices of essentials on Canadians’ cost of living, indebtedness, and feelings of financial security. This means that the small increase in real after-tax incomes over the past 40 years described above does not reflect the lived experience of affordability and financial security for millions of Canadians.
How tax changes have favoured the 1%
The inequality and related affordability concerns Canada faces today are the result of long-standing economic trends caused by neoliberalism. Changes to our tax system have been a key component of the neoliberal shift in Canada. The tax system can affect economic incentives, redistribute economic benefits and generate revenue to invest in needed public infrastructure and services. We review how broad changes in the tax system over the past 40 years have contributed to the current crisis to understand what changes are needed today.
Personal income taxes
Coming out of World War 2, Canada had a highly progressive personal income tax system. In 1949 there were 17 tax brackets with a marginal tax rate of 84%15 for the top bracket in Ontario (combining both federal and provincial income taxes).16 Few Canadians actually paid taxes at this rate because the threshold for this tax bracket was so high (in today’s dollars, the threshold for the top bracket fell from $5.3 to $3.0 million from 1949 to 1971). But this highly progressive system encouraged equality of market incomes and raised enough revenue to support the establishment of important public programs like universal healthcare.
In 1972, a major tax reform significantly reduced income taxes on the very wealthiest - the top marginal rate was cut from 82.4% to 61.1%.17 The government’s own calculations showed that the largest beneficiaries of this reform would be those with the highest incomes. Further major tax cuts were implemented in 1982 and 1987, cutting the top combined marginal tax rate to 51.1%. To be clear, the top marginal tax rate has no impact on the vast majority of Canadians. About 1% of Canadians paid taxes at this rate in 2022, and in 1970, less than 0.1% of Canadians paid the top marginal rate. Figure 5 shows the top marginal personal income tax rate in Canada over time.
Cutting the top marginal tax rate directly reduces government revenues and can undermine our ability to pay for essential public services. Beyond this direct impact, these tax cuts also contributed to the current affordability crisis by changing the incentives of firms and their owners. When top marginal tax rates are high, there is less benefit to firms for paying out exorbitant salaries and bonuses to their executives and increasing dividends to shareholders. If a CEO is paid $500,000 in salary when the top marginal tax rate is 80%, only $200,000 of a $1 million bonus would be kept by the CEO. But, if the top marginal tax rate is only 50%, the CEO would keep $500,000, a much better use of the company’s money (from the company’s perspective).
Indeed, both in Canada and the United States, there was an explosion in executive pay starting around the 1980s, closely following significant reductions in top marginal tax rates.18 At the same time, increases in economic growth began to diverge from increases in median income in Canada.19 This suggests that cuts to top marginal tax rates may have incentivized growing firms to use extra cash to increase executive pay rather than to increase worker pay.
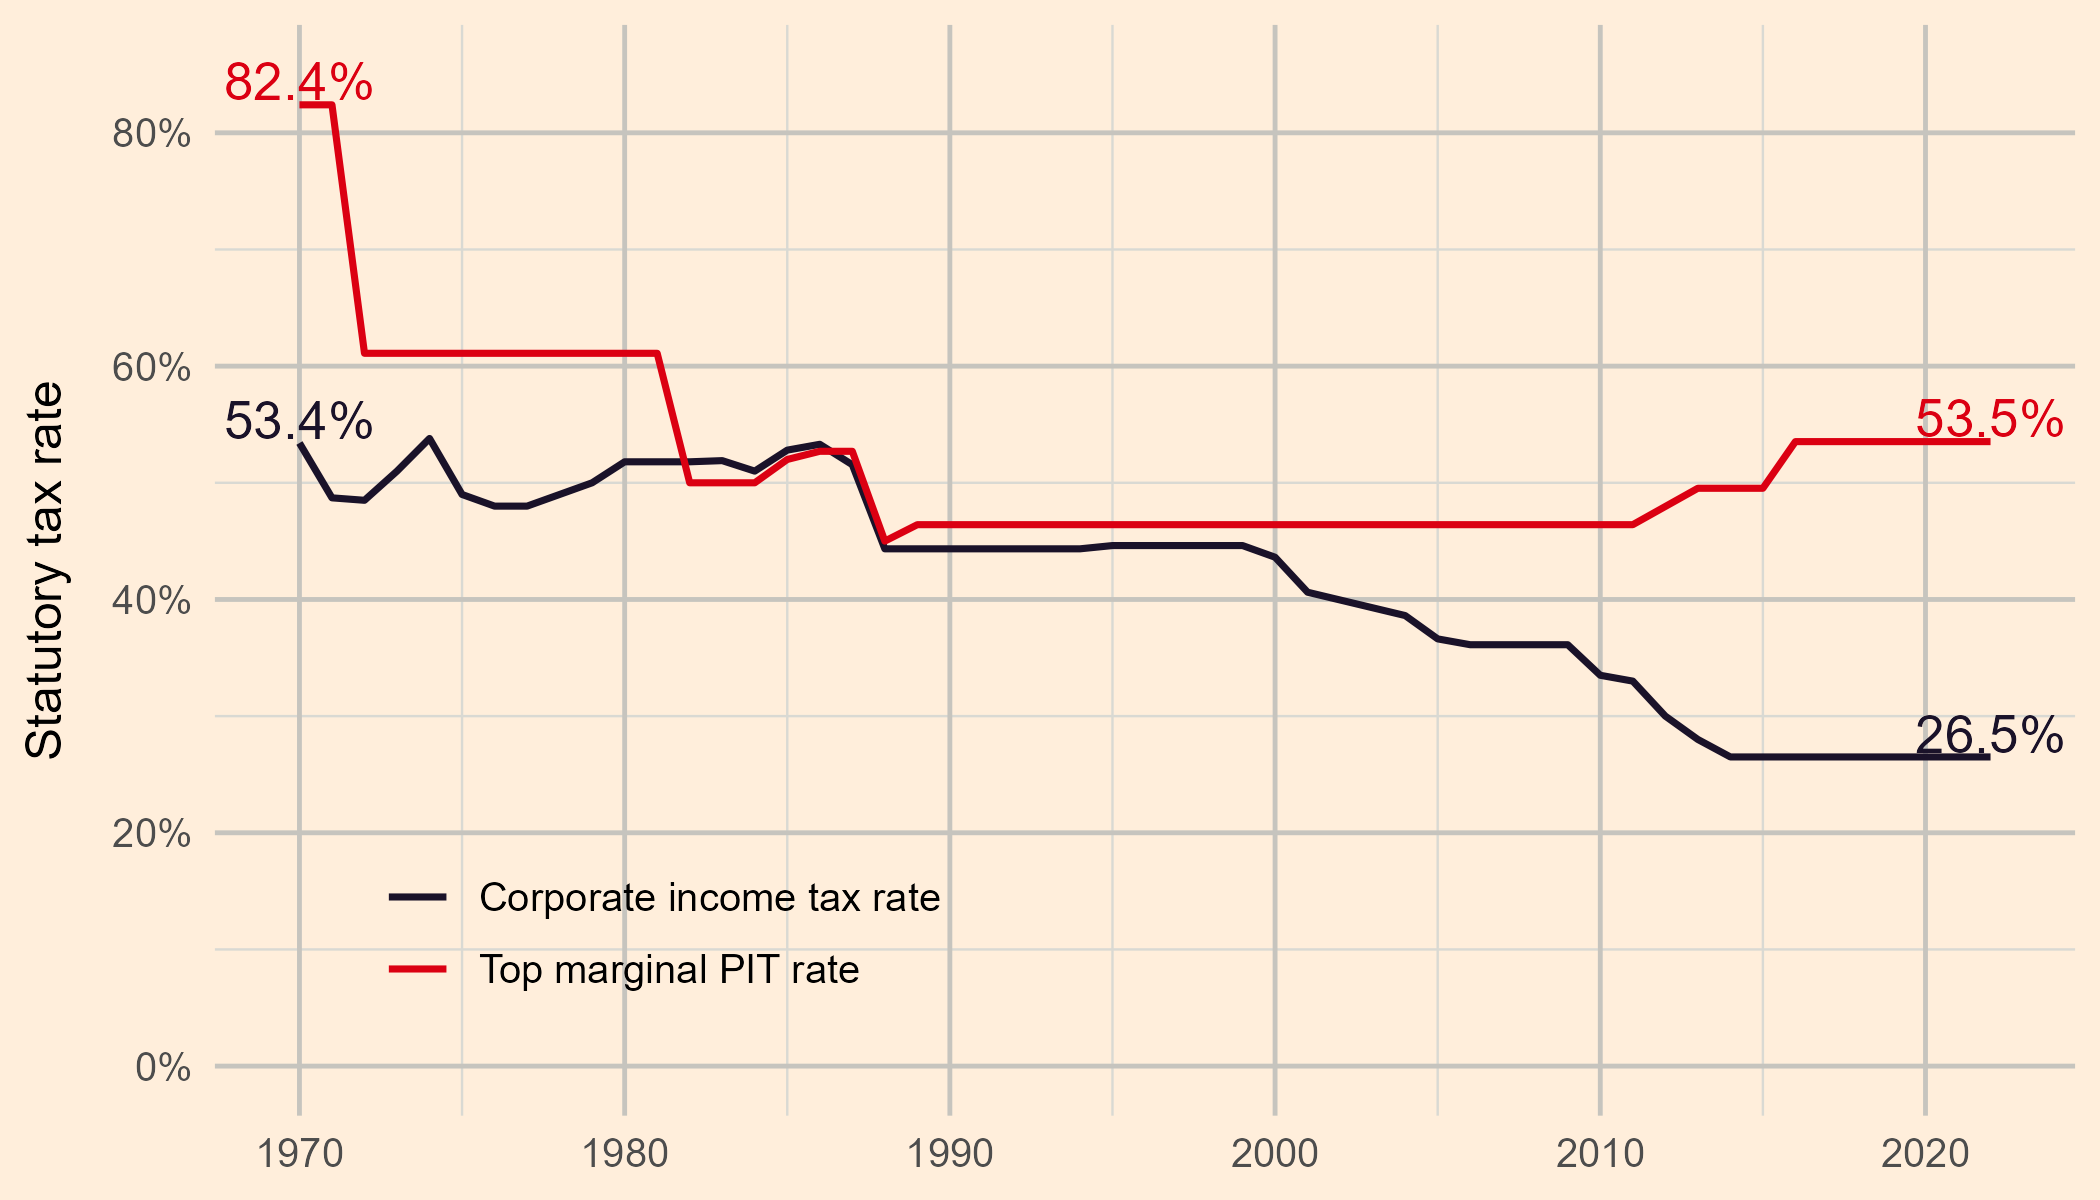
Figure 5. Top marginal PIT rate and CIT rate, 1970-2022
Figure 5. Combined federal and provincial corporate income tax rate and top marginal personal income tax (PIT) rate, Ontario, 1970-2022.20
Corporate income taxes
Throughout the neoliberal period, Canada has also drastically cut corporate income tax rates. In 1982, the combined federal and provincial corporate income tax rate in Ontario was 51.8%. The 1988 tax reform cut this to 44.3%. Further cuts came under Chretien’s Liberal government in the early 2000s, when it fell to 36.6%, and under Harper’s Conservatives, when it fell to 26.5%, just over half of its rate 40 years earlier.
While cutting top personal income tax rates encourages firms to pay top executives more, cutting corporate income tax rates encourages firms to keep more profits. Though some argue that more profits are good for everybody because they leave more money for investment, profits are what are left after paying workers and accounting for capital depreciation. In other words, corporate income tax cuts encourage firms to leave more money in the pockets of shareholders instead of paying workers more and reinvesting in the economy.
This is exactly what corporations have done. Corporate tax cuts have not substantially increased business investment.21 Instead, they have resulted in an increasing share of GDP going to corporate net operating surplus (a proxy for profits). In 2022, 16.0% of GDP went to corporate net operating surplus, nearly double the 8.9% of 1982.22 This means that a greater share of what has been produced by Canadians is being collected by those who own corporations, who are disproportionately the wealthiest Canadians.23
So, it is no wonder that half of Canadians have less real market income today than they did 40 years ago. It is the result of government policy, including tax policy, that continues to shift both money and power from workers to corporate owners. Neoliberal policy changes incentivize corporate owners, who have considerable power over prices and wages, to increase prices faster than they increase wages.
Overall tax burden
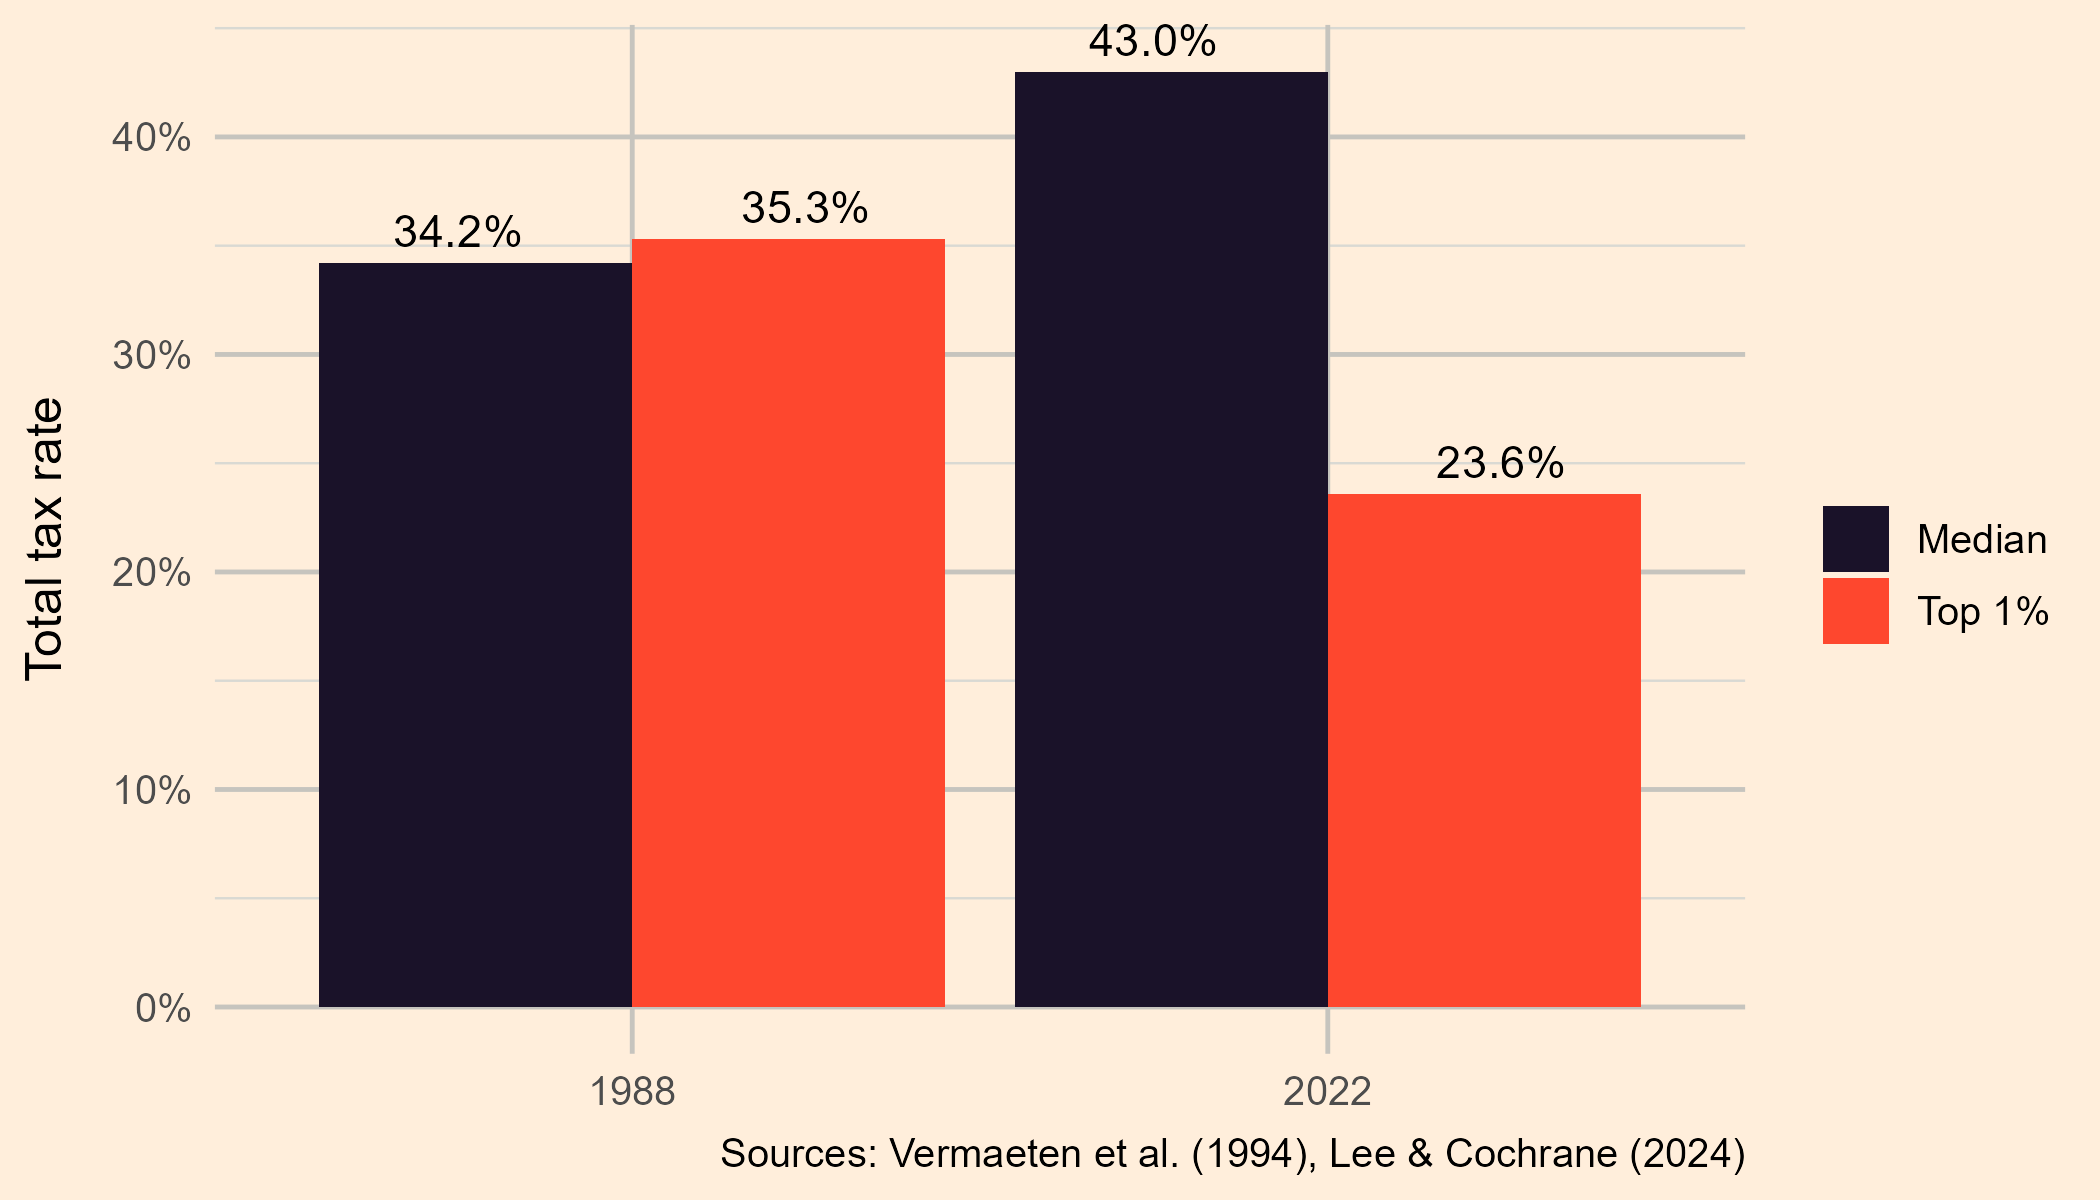
Total median and top 1 tax rate, 1988 and 2022
Figure 6. Total tax rate for a median earner and the top 1%, 1988 and 2022.
Taken together, after all these regressive changes to the tax system, someone with a median income paid about 43% of their income24 in taxes in 2022 while the top 1% paid only 23.6% of their income in taxes.25 This is a significant change from 1988, when both a median earner and the top 1% paid about 35% of their income in taxes.26 While Canada’s personal income tax system is still progressive, meaning that there is a higher statutory tax rate on higher levels of annual income, the overall tax system has become increasingly regressive. This is due in part to the decline in corporate income taxes and the introduction of the GST, which costs low-income workers a much greater portion of their income than the wealthy. Furthermore, forms of income collected predominantly by the wealthy, like capital gains and undistributed corporate earnings, face a lower tax rate than workers’ income.
Recommendations
As challenging as this all may sound, if the current affordability crisis was caused by policy changes, it can also be resolved by policy changes. Tax reforms alone will not be sufficient to reverse 40 years of neoliberalism, but they will help. We can use tax policy to raise revenue to fund essential public services and provide public alternatives to essential goods provided by the private sector at exorbitant prices. It can also be used to incentivize firms to pay more to workers and less to executives and shareholders. But this will take a fundamental shift in how we think about taxes.
Throughout the neoliberal era, taxes have been thought of primarily through the lens of international competition. The cuts to personal and corporate income taxes over the past 40 years in Canada have not occurred in a vacuum. Taxes on the wealthy have been cut in the United States, Europe and around the world during the neoliberal era, and Canada has felt compelled to respond accordingly. We have cut top marginal income tax rates and corporate income tax rates, taxes primarily paid by the wealthy, out of the fear of losing capital, investment, and jobs to other countries. According to the neoliberals, these cuts should spur economic growth and innovation. However, research has found that cutting taxes on the wealthy has no impact on economic growth, increasing income inequality instead.27 This competitive tax-cutting is only possible due to a lack of international coordination on taxation.
To help stop the international race to the bottom on taxing the wealthy, our first recommendation is that Canada must work to advance international coordination on taxation multilaterally. At the UN, led by the Africa Group, steps have been taken towards an international tax convention that would address “tax evasion and avoidance by high-net worth individuals” and fair taxation of multinationals.28 Negotiations on this convention began in February 2025. At the G20, Brazil has advocated for a global wealth tax on billionaires.
Canada continues to resist both of these efforts, protecting the ultra-rich, who have benefitted at the expense of everyone else. Canada should instead promote coordination on increasing corporate tax rates and taxes on the ultra-wealthy on the international stage, blazing a path for others to follow. This multilateral coordination should replace bilateral coordination through tax treaties. These treaties have only allowed multinational corporations to engage in “treaty shopping” to lower their tax rates,29 so Canada should end all tax treaties with tax havens.
Although international coordination is a priority, there is no need to wait. Trump’s return to office is demonstrating that Canada needs to be able to stand on its own. If Canada wants to help stop the climate crisis and ensure that every Canadian has an affordable place to live, then Canada’s tax policy should be aligned with those goals rather than the threats of international capital.
To fund our much-needed investments in a just transition and affordable housing, Canada should implement a wealth tax domestically. Canada’s billionaires increased their wealth by $190 billion since the onset of the pandemic. This wealth concentrates power in a few hands, as we are seeing with the enormous influence of tech billionaires on policy in the United States. A wealth tax of 1% on wealth over $10 million, 2% over $50 million, and 3% over $100 million would only affect 0.5% of Canadians and could raise over $30 billion per year.30 It should be combined with steep exit taxes so that billionaires cannot avoid the tax by simply leaving the country.
Canada should introduce a super-profits tax of 5% on corporate profits above $1 billion. At this level, the overall corporate tax rate for large firms would still be lower than it was during the 2000s. Since most investment does not come from taxable income, this would have little effect on investment,31 while raising $8 billion per year.32
To truly address the affordability crisis, these tax changes must be coupled with measures that promote the power of organized labour and ensure that prices of essential goods do not rise faster than incomes. To this end, we recommend that the revenue raised by these tax changes be used to support the construction of non-market housing, the stabilization of food prices, cooperative businesses, and a just transition away from fossil fuels. These actions would set us on a path away from neoliberalism and contribute to raising the living standards of those most vulnerable in the long run, a better goal than endless economic growth that benefits only the wealthy.
End notes:
1 George Monbiot & Peter Hutchison. (2024). Invisible doctrine: The secret history of neoliberalism. Allen Lane.
2 Stephen Metcalf, 2017, Neoliberalism: The idea that swallowed the world. The Guardian.
3 Saez, E., & Veall, M. R. (2005). The Evolution of High Incomes in Northern America: Lessons from Canadian Evidence. The American Economic Review, 95(3), 831–849.
4 All measures of income in this report include capital gains.
5 Using data from tax filings in the Longitudinal Administrative Databank, tax filers are sorted into groups according to their income level. We present results for 1982-2022 (the full period with available data) for four groups: the bottom half of income earners, the next 49% of income earners (the top half of earners excluding the top 1%), the top 1% of income earners, and the top 0.01%.
6 During the 2000s and early 2010s, global commodity prices increased significantly. As a commodity-exporting country, Canada benefited significantly from higher export prices. This translated into higher profits, and eventually higher wages, in resource extraction industries. Green and colleagues showed that this had spillover effects on other industries, ultimately accounting for half the increase in real wages in Canada from 2000 to 2012.
7 Market income includes all income from employment, pensions, and investments but does not include government transfers or income taxes.
8 The price of “Digital computing equipment and devices” declined by 96% from 1995 to 2022 in the CPI.
9 Statistics Canada, 2023, Household spending by household income quintile, Canada, regions and provinces.
10 Data comes from Statistics Canada Tables 11-10-0222-01 and 11-10-0197-01. Older data is available here.
11 Statistics Canada, 2023, Household spending by household income quintile, Canada, regions and provinces.
12 Statistics Canada, 2024, Household sector credit market summary table, seasonally adjusted estimates.
13 Iorwerth, A., May 23, 2023. Risks to Canada's economy remain high as household debt levels continue to grow. Canada Mortgage and Housing Corporation.
14 Canada Mortgage and Housing Corporation, 2025, Housing Market Information Portal.
15 Smith, R. S. (1995). The personal income tax: average and marginal rates in the post-war period. Canadian Tax Journal, 43(5), 1055-[xxvi].
16 The provincial portion of the top marginal personal income tax rate varies across provinces. Ontario is used as an example because it is the largest province and all provinces follow roughly the same trend.
17 Benson, E. J. (1971). Summary of 1971 Tax Reform Legislation.
18 Saez, E., & Veall, M. R. (2005). The Evolution of High Incomes in Northern America: Lessons from Canadian Evidence. The American Economic Review, 95(3), 831–849.
19 Greenspon, J., Stansbury, A., & Summers, L. H. (2021). Productivity and pay in the United States and Canada. International Productivity Monitor, 41, 3-30.
20 Corporate income tax data from Open Canada. Top personal marginal income tax rates compiled from a variety of sources including taxtips.ca, Summary of 1971 Tax Reform Legislation, and Income Tax Reform.
21 Stanford, J, 2011, Having their cake and eating it too: Business profits, taxes and investment in Canada, 1961-2010, Canadian Centre for Policy Alternatives.
22 Statistics Canada. (2024). Table 36-10-0221-01: Gross domestic product, income-based, provincial and territorial, annual (x 1,000,000).
23 Wolfson, M., Veall, M., Brooks, N., & Murphy, B. (2016). Piercing the veil: Private corporations and the income of the affluent. Can. Tax J., 64, 1.
24 These estimates are based on the concept of “broad income”. This includes income from wages, investments, and government transfers, as well as corporate profits, employer benefits, and inheritances. See Vermaeten and colleagues (1994), and Lee and Cochrane (2024) for more details.
25 Lee, Marc, & Cochrane, D. T. (2024). Canada’s shift to a more regressive tax system, 2004 to 2022. Canadian Centre for Policy Alternatives and Canadians for Tax Fairness.
26 Vermaeten, Frank, Gillespie, W. Irwin, & Vermaeten, Arndt. (1994). Tax incidence in Canada. Canadian Tax Journal, 42(2), 348-416.
27 Hope, D., & Limberg, J. (2022). The economic consequences of major tax cuts for the rich. Socio-Economic Review, 20(2), 539-559.
28 UN General Assembly. 2024. Chair’s Proposal for Draft Terms of Reference for a United Nations Framework Convention on International Tax Cooperation.
29 Arel-Bundock V., 2017, The Unintended Consequences of Bilateralism: Treaty Shopping and International Tax Policy. International Organization, 71(2):349-371. https://doi.org/10.1017/S0020818317000108
30 Hemingway, A., 2023, Why Canada still needs a wealth tax—and what it could fund, Policynote.
31 Brun, Lídia and González, Ignacio and Montecino, Juan. Corporate Taxation and Market Power Wealth (April 5, 2023). Available at http://dx.doi.org/10.2139/ssrn.4410717.
32 Silas Xuereb. 2024. Taxing excess profits in Canada: An urgent proposal for action. Canadians for Tax Fairness.
